Fund-Raising Results are Improving
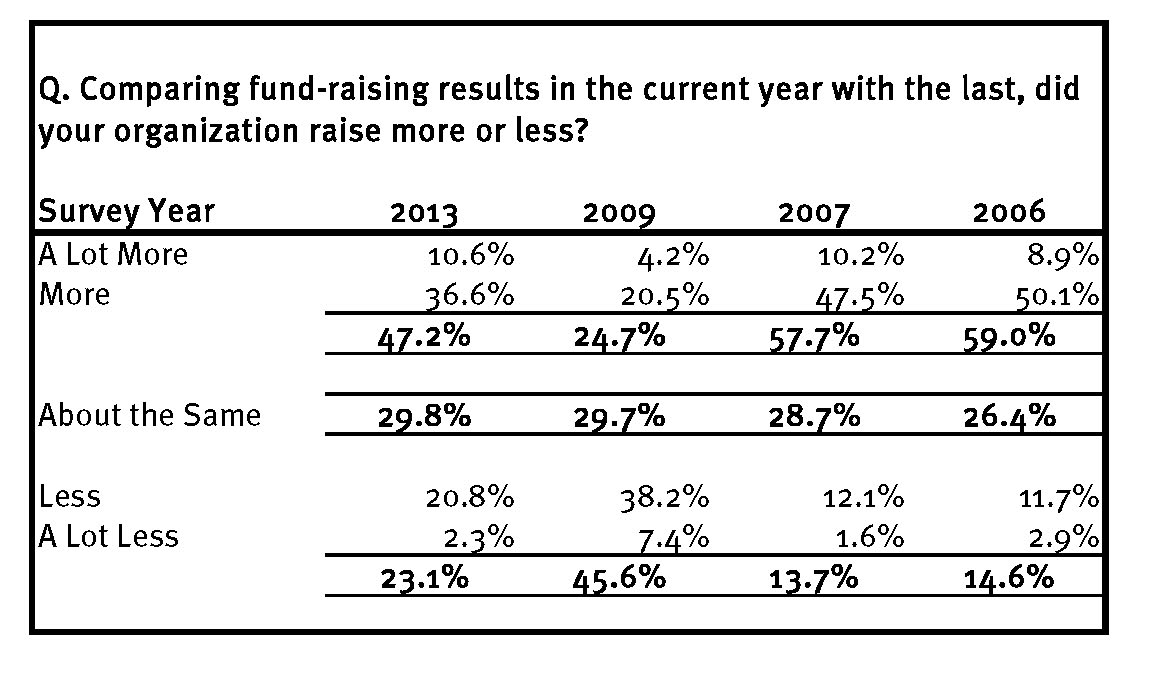
The most encouraging discovery in our Outlook 2013: The Road Ahead Survey is the report of more favorable fund-raising results for last year. While it does not appear that as many organizations have reached the success levels reported in our 2006 survey, things are clearly improving . . . a lot!
The adjoining table compares the past four survey response tallies, where this time 47 percent say they raised more than last year. And, the number who reported raising less than last year has dropped by about the same margin.
Analyzing the results of our 2009 survey was rather simple, as most everyone recognized that in 2008 and 2009 “it was the economy stupid.” But, what has lead to the philanthropic sector’s improvements this year? Was this improvement limited to one sector and not another? And, how have the successful organizations reached improved results?
In reviewing the results of our Outlook 2013 Survey, we’ve completed the most comprehensive and in-depth analysis of the survey data that we’ve ever done in search of a little insight to the marketplace and what our colleagues are thinking and doing.
Survey participants offered some basic organizational profile information that we have used to tabulate the response data, including:
- type of organization (focus of mission),
- total annual operating budget,
- number of development (fund-raising) personnel employed,
- portion of annual budget derived from voluntary contributions,
- and, fund-raising results.
We considered each of these distinct organizational characteristics in reviewing the survey data, and tabulated unique organizational characteristics across most if not all of the survey questions. Quickly, the 24 questions generated thousands and thousands of variations to consider.
A good cross-section of the nonprofit sector participated in our survey, and the mix of respondents is consistent over each of the four surveys. The two most frequently responding organizational types are health care and education.
The number of professional development staff employed by organizations may be changing. Nearly 30 percent of survey respondents had one development staff member, which is above the four survey average and a six-point increase from 2009.
One third of the organizations completing the survey had annual budgets of $20 million or more, which was also consistent to previous years. Another third reported annual budgets of $2.5 million up to $20 million, and the final subgroup analyzed had budgets of less than $2.5 million.
Nearly half of the survey is represented by organizations that raise less than 10 percent of their organization’s total annual operating budget.
We also compared results between Outlook 2013 and the three previous surveys and identified some interesting trends that will be helpful to development professionals as they chart The Road Ahead in 2013 for their organizations.
We think you’ll find Outlook 2013: The Road Ahead Survey Report of great interest, and we are pleased to offer the full report for your review and use. Or, better yet, give us a call to arrange an initial consultation.
click here for pdf version: FRM58