Few industry insiders will argue that 2014 was a record giving year, as this report clearly identifies. The good folks at Atlas of Giving have come out with their 2014 annual report. Some may remember this group from their dust up with Giving USA about a year ago. We’re not picking sides on which enterprise employs the best method. But we do believe that a little competition is good for the industry. We also enjoy consider different viewpoints on estimating the level of giving in our great nation. We’ve highlighted some of the facts contained in their report, which is very informative.
Atlas of Giving
U.S. Charitable giving: 2014 results & initial 2015 forecast
2014 charitable giving review
Total Charitable Giving in 2014 was a record $456.73 Billion – up 9.3% over 2013. This extraordinary sum was fueled by favorable economic factors that drive giving, an increasing number of nonprofits, the impact of donor advised funds and new and more effective fundraising technologies and techniques.
Charitable Giving in the U.S. is primarily a function of specific economic, demographic, and event factors. Individuals cannot give unless they have disposable income or surplus assets such as stock or real estate. Grant-making foundations are able to give more when the values of their investment portfolios grow. Corporate donors are able to give when their earnings are strong and their debt is low. Growing numbers of nonprofits means more new giving.
An improved employment picture drove much of the growth. Individual donors account for 74% of all U.S. giving. As a result, improving employment significantly impacts the overall U.S. giving total.
other contributing factors
Double digit growth in stock prices fueled giving to organizations that rely on campaigns and major gifts, such as Colleges and Universities.
Low inflation has given individuals and corporations more discretionary income for making charitable contributions.
Consumer confidence is high. When consumers feel good about the economy, they tend to give more.
Historically low interest rates help everyone’s bottom line. When individuals and businesses are paying less on borrowed money, they have more to give.
A significant reduction in energy prices frees up more discretionary income. Finding lower prices at the gas pump is like finding new money for donors and potential donors.
non-economic factors
Nationally, the number of nonprofits has grown 50% in the last 12 years.
Growing utilization of more sophisticated fundraising technology like online giving, crowd-funding, and prospect screening algorithms means that charities are becoming more effective and efficient in raising money every year.
There has been a substantial increase in giving to donor advised fund accounts and grants from those accounts. In 2014, these funds accounted for $29.44 billion of all charitable giving – 6.4% of the 2014 total.
additional giving facts
- Individual mega-gifts of $100 million or more accounted for about 1% of all giving.
- Annual growth in giving to the Human Needs/Disaster, Education, and Environmental sectors has been in the double-digits since 2010.
- Church giving is growing at less than half the rate of the fastest growing giving sectors.
- Improving employment numbers provide the best giving benefit to nonprofits that rely on small gifts from many individual donors.
- Online giving continues to increase in popularity.
- The impact of donor advised funds on the charitable giving economy is the most substantial change since the recession.
2015 charitable giving forecast
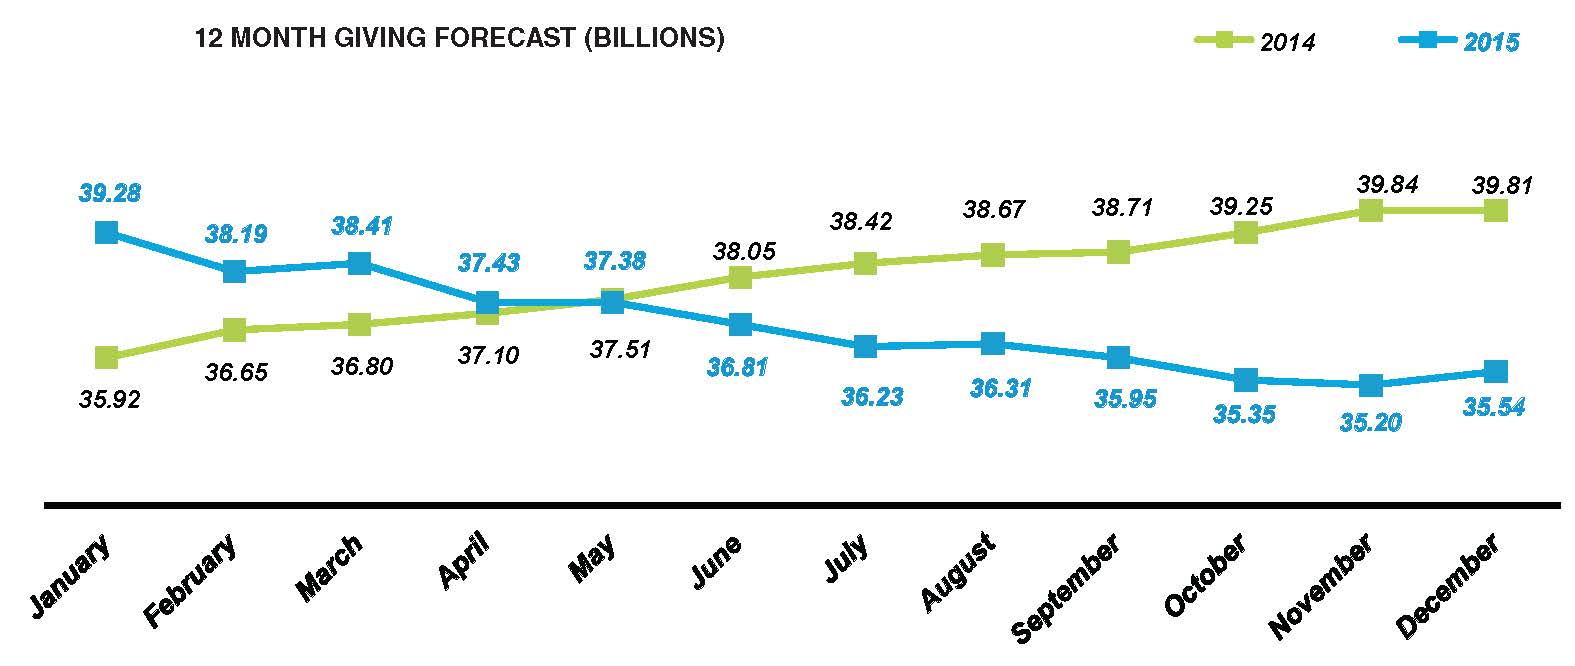 Initially, the 2015 forecast is bleak at best. The early forecast suggests that giving could drop 3.2% to $442.08 billion. This projected decrease is largely a function of:
An expected correction in stock prices – A decline ending the 4th longest bull market in US history will significantly impact giving to donor advised funds, the education sector (2nd largest giving sector), and any nonprofit that relies heavily on major gifts or campaign giving.
An expected increase in interest rates in the second half of 2015 – Paying more in interest will impact discretionary income for both individual and corporate donors
Eurozone trouble led by weakening economies in Germany, France, and Italy – Forty percent of all publically traded stock company sales are to the Eurozone. A weak Eurozone economy will negatively impact the ability of U.S. corporations to make charitable gifts.
Continuing decline in employment compensation – Though 2014 brought some much needed employment news, compensation levels for the employed are still below pre-recession levels. In addition, underemployment is a growing drain on the economy and charitable giving.
Rising geostrategic corporate competition, primarily from Asia – As Asian goods and services provide more competition, the value of U.S. companies is weakened. This puts pressure on American jobs and compensation, leading to less money available to the charitable giving economy.
The Atlas of Giving updates its forecast monthly.