It seems that everywhere we go these days, clients ask us about social media, crowdfunding, and the slew of other online communication and fundraising vehicles available. The good folks at Nonprofit Tech for Good have posted a great collection of 14 recent stats that are quite insightful. Clearly, every organization should be looking at these vehicles to complement and round out their recurring gifts strategy. At the same time one must remember that the good-old-fashioned method of face-to-face, peer-to-peer appeals still works best for major gift fundraising. And, major gift fundraising is the best, most effective and efficient method of raising more money!
14 Must-Know Stats About Fundraising, Social Media, and Mobile Technology
Spring is report season in the nonprofit sector. A slew of new data is released and this year the emerging theme is that online fundraising is rapidly rising, especially on mobile devices. Nonprofits that have not yet adopted a mobile-first approach to online communications and fundraising can use the new data to help convince executive staff and board that a new mobile-compatible website should be high on their priority list. Crowdfunding, peer-to-peer fundraising, monthly giving, and email fundraising is also proving to be effective, as you can read and see below.
1. Responsive design doubles giving on mobile devices.
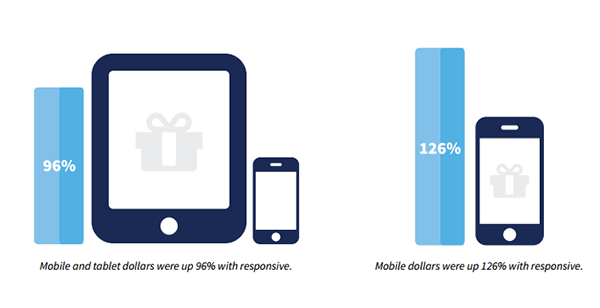 Source: DonorDrive
2. Facebook refers 29.4% of traffic to donation pages
on #GivingTuesday.
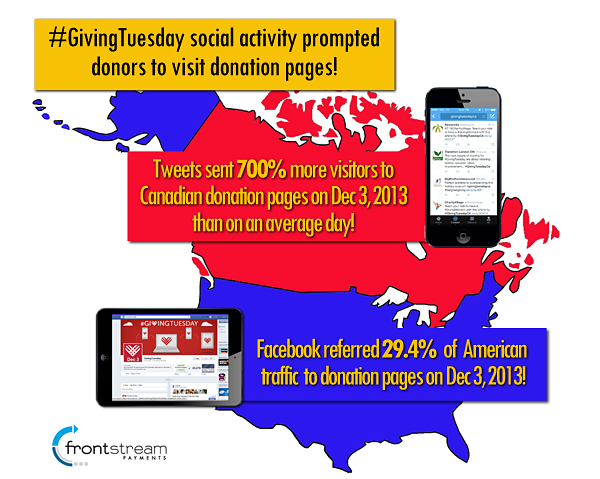 Source: Artez Interactive
3. Fifty-five percent of those who engage with nonprofits via social media have been inspired to take further action.
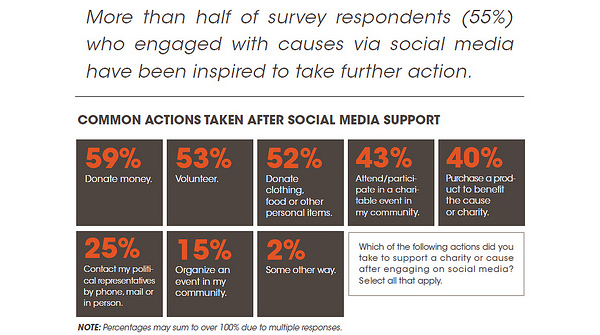 Source: Waggener Edstrom
4. For every 1,000 fundraising emails sent
a nonprofit raises $17.
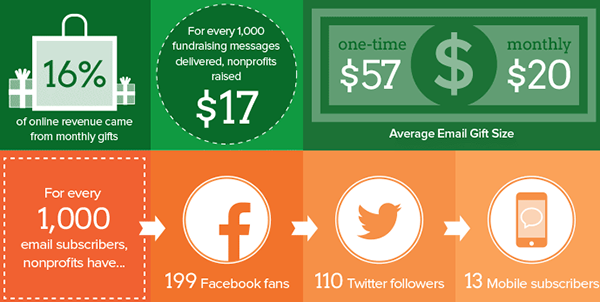 Source: M+R and NTEN
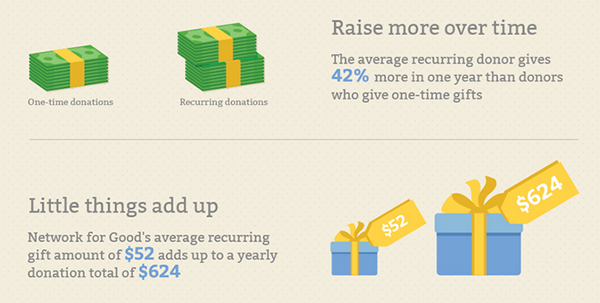
5. Monthly donors give 42% more in one-year than
one-time donors.
 Source: Network for Good
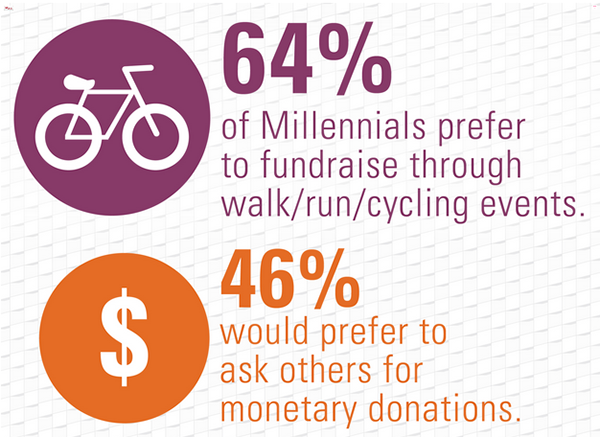
6. Sixty-four percent of Millennials prefer to fundraise through walk/run/cycling event.
 Source: Millennial Impact
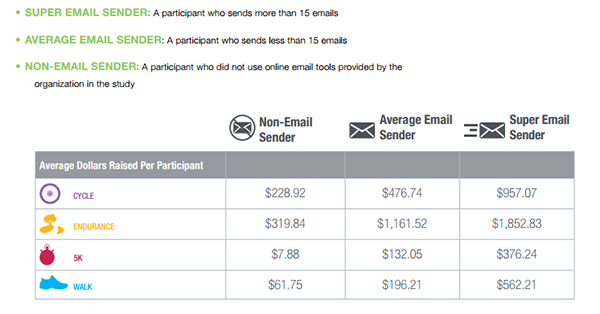
7. Walk/run/cycling event fundraisers who send more than 15 emails raise 76% more than non-email senders.
 Source: Blackbaud
8. The average nonprofit crowdfunding campaign
raises $9,237.55.
 Source: craigconnects
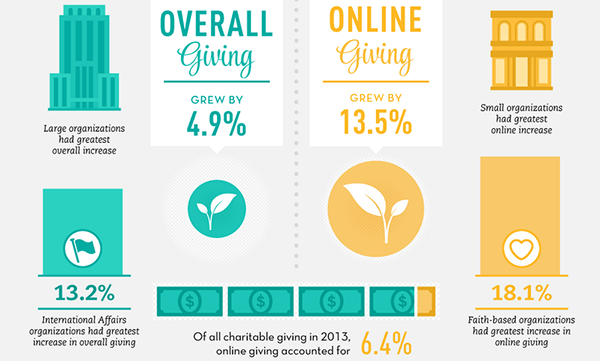
9. Online giving grew 13.5% in 2013.
 Source: Blackbaud
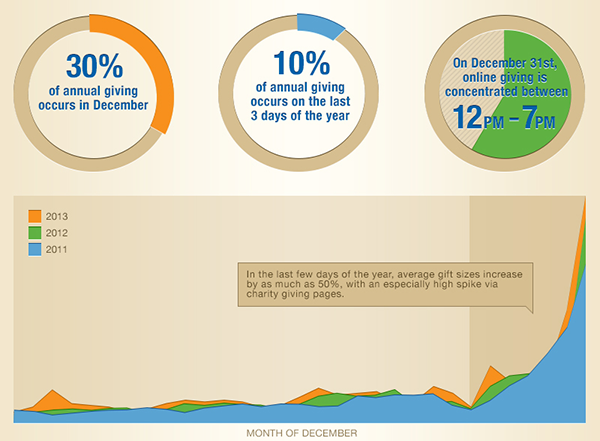
10. Ten percent of annual giving occurs on the last
three days of the year.
 Source: Network for Good Digital Giving Index
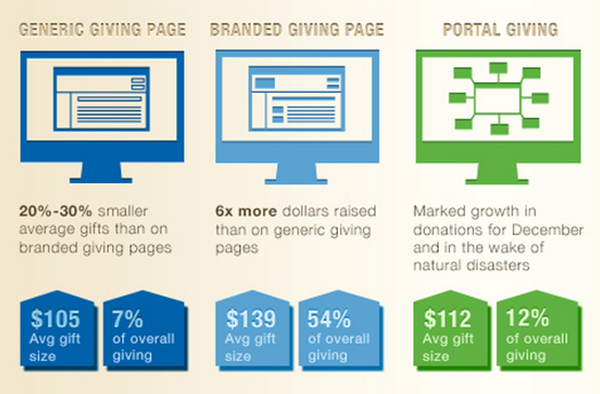
11. Custom-branded donate pages nested inside a nonprofit’s website raise 6X more money.
 Source: Network for Good Digital Giving Index
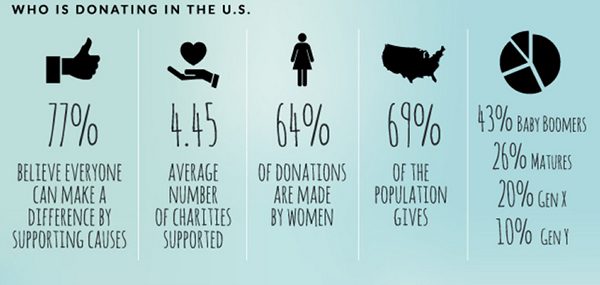
12. Sixty-four percent of donations are made by women.
 Source: Everyday Hero
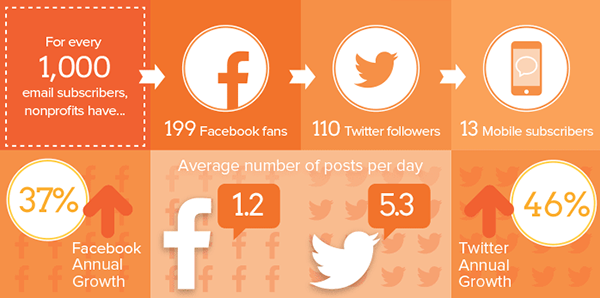
13. Nonprofits share a daily average of 1.2 updates on Facebook and 5.3 tweets.
 Source: M+R and NTEN
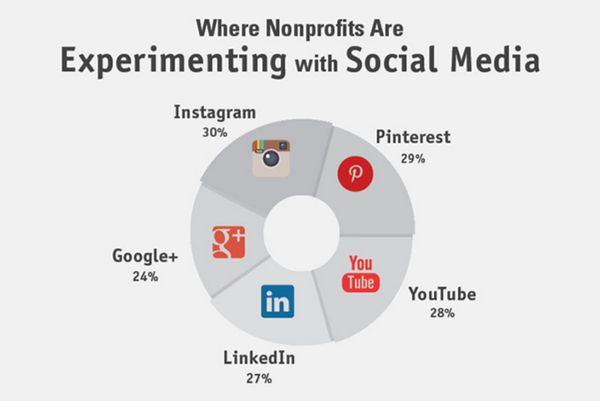
14. Thirty percent of nonprofits are experimenting
with Instagram.
 Source: Nonprofit Marketing Guide
